The Price is Wrong
The Massive Impact of (Mis)pricing Investment Products
June 2018
Highlights
How much to charge for an investment product is a decision asset managers wrestle with daily, and the financial implications of that decision are staggering. We analyze a universe of more than 20,000 global shareclasses of open-end funds and ETFs through the Flowspring Global Pricing Model and Flowspring Global Flow Model to make sense of the rapidly changing pricing landscape for investment products. Our key findings include:
Asset managers have lowered fees on existing products such that they’ve given up more than $6 billion in revenue collectively since early 2014.
Over the last 12 months, differences in expense ratios across funds account for $480 billion in fund flows among funds.
The most underpriced new funds can expect to grow more than 12x faster than the most overpriced new funds in their first year. New funds also tend to underprice relative to the competition in order to secure these high growth rates.
High turnover ratio and high volatility are fund characteristics most associated with higher prices while a fund being exchange traded and having high AUM are most associated with lower prices.
Of the top 25 fund families by AUM, Vanguard has received the greatest flows due to its pricing strategy, while Oppenheimer Funds have benefitted the least.
Fee Cuts are Accelerating, and the Impact on Flows is Enormous
There are four drivers of continued pricing pressure in the asset management industry.
Investors are more aware of cumulative impact of fees on returns
Investors more focused on reaching financial goals than outperforming a benchmark
Investors are less enchanted with the idea of star managers that can outperform the market
Passive investing and technological advances have made it less costly to provide asset management services
The above four drivers boil down to one thing: the perception and reality of the asset management business is that it has become more commodity-like, and when firms can no longer compete on the differentiation of their offerings, they compete on price. Consequently, we’ve seen asset managers make the tough decision to lower their fees to the tune of more than $6 billion in aggregate in an attempt to remain competitive.

Figure 1: Cumulative aggregate fee change over time in US Dollars
The question arises: how long can this trend continue? Some firms have already reached what is possibly a lower bound at 0% expense ratios – choosing to monetize their products in other ways, including securities lending. Yet we see no reason to believe that any of the four key drivers of pricing pressure will subside in the foreseeable future. Consequently, the massive producer surplus achieved by the asset management industry will continue to transform into a consumer surplus as elasticity of demand increases, and asset managers lower their fees in response.

Figure 2: Aggregate fund flows explained by differences in net expense ratios
We see evidence of this in the Flowspring Global Flow Model which allows us to attribute observable fund flows to various fund characteristics. Over the last 12 months, $480 billion of flows were attributable to differences in expense ratios across funds. This compares to $456 billion and $211 billion in the prior two years respectively. Clearly fees are becoming a bigger factor for investors when considering how to allocate their wealth.
Some Fund Families are More Aggressive than Others
As fees have become a bigger factor, some fund families have strategically decided to cut deep and cut fast. Fidelity Investments cut $1.4 billion dollars in fees from its existing funds over the last 12 months. Only two of the top 25 fund families ranked by fees actually increased fees in aggregate over the trailing 12 months – PIMCO and Dimensional Fund Advisors.
Having differentiated, value-adding products is the only defense asset managers have against the force of fee reductions. Paradoxically, most fund managers believe they have differentiated value-adding products, and therefore believe they can weather the storm better than others. Those that are wrong, not just about the reality, but the perception of their products, will face significant outflows.
| Fee Cuts | Initial Fees | Percent Drop | |
|---|---|---|---|
| Fidelity Investments | -1,438,332,144 | 9,350,367,073 | -15% |
| OppenheimerFunds | -276,554,579 | 2,439,461,559 | -11% |
| American Century Investments | -104,826,672 | 1,146,964,416 | -9% |
| JPMorgan | -135,750,876 | 2,620,863,455 | -5% |
| BlackRock | -74,886,284 | 1,859,523,607 | -4% |
| iShares | -102,094,050 | 2,860,645,826 | -4% |
| Janus Henderson | -33,060,991 | 938,126,796 | -4% |
| Columbia | -43,849,934 | 1,428,035,163 | -3% |
| SPDR State Street Global Advisors | -28,532,367 | 977,444,438 | -3% |
| Vanguard | -129,343,504 | 4,520,090,649 | -3% |
| T. Rowe Price | -126,342,517 | 5,115,277,448 | -2% |
| Principal Funds | -32,442,459 | 1,440,131,920 | -2% |
| Wells Fargo Funds | -16,343,157 | 883,777,528 | -2% |
| American Funds | -173,048,561 | 9,889,803,162 | -2% |
| MFS | -31,812,187 | 1,981,183,449 | -2% |
| Hartford Mutual Funds | -14,802,172 | 1,032,603,908 | -1% |
| AXA Equitable | -16,506,611 | 1,309,257,760 | -1% |
| John Hancock | -19,702,409 | 1,714,767,694 | -1% |
| Lord Abbett | -10,809,986 | 1,003,150,628 | -1% |
| Dodge & Cox | -6,374,224 | 1,072,775,748 | -1% |
| Franklin Templeton Investments | -19,506,006 | 3,492,952,983 | -1% |
| Jackson National | -8,967,687 | 1,753,316,673 | -1% |
| Invesco | -4,691,441 | 1,524,208,110 | 0% |
| Dimensional Fund Advisors | 1,415,622 | 1,314,215,343 | 0% |
| PIMCO | 55,532,143 | 2,358,439,974 | 2% |
Figure 3: Dollar amount of fees cut on existing products
Overpricing a New Fund is a Devastating Mistake
Maybe even more important than fee changes in existing funds are initial fee levels for new funds. Half of all funds in existence today were started launched within the last 10 years. Making new fund launches a huge driver of transformation in the industry.
New funds are fragile. They don’t have a performance track record to rely upon. They typically haven’t been seeded with a level of assets that make all investors comfortable. They may have operational kinks to work out. Because of the dearth of information about new funds, the available information holds more weight.
We use the Flowspring Global Price Model, a factor model for fund prices, to determine the competitive pricing level for all funds. Then by comparing a fund’s current price to its competitive price, we can determine how over- or under-priced it is. What we find in this analysis is that new funds have been underpricing themselves.
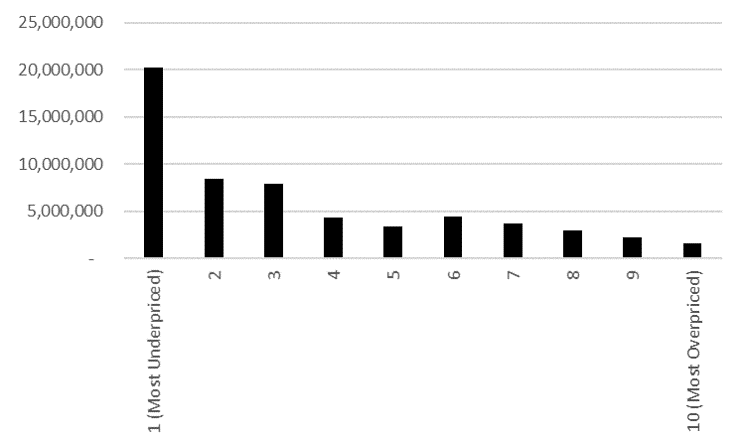
Figure 4: Median subsequent 3-year AUM growth of new funds grouped by overpricing deciles
The 10 percent of new funds that are most underpriced relative to their competition grow, on median, 12 times faster than the 10 percent of new funds that are the most overpriced. At a time when AUM growth is crucial, it’s no wonder asset managers are pricing their new funds below competitive levels.

Figure 5: Average overpricing (in bps) of funds by fund age
On average, funds that are less than one year old are currently underpriced by a bit more than 1 basis point, and funds that are more than 10 years old are overpriced by more than 5 basis points. The results are clear that, on average, the newer the fund, the more likely it is to be underpriced. In other words, asset managers understand the value of growing new funds quickly and will sacrifice a bit on its expense ratio to get it.
Pricing Considerations are Evolving
So what factors drive a pricing decision from asset managers? Using the Flowspring Global Pricing Model as an attribution tool, we can determine the specific factors that play the largest role.
We find the most positive contributors are those that define the investment strategy of the fund. Higher turnover ratio, higher return volatility, and allocation to non-US stocks top the list of factors that lead to higher prices.
On the flip side, the biggest detractors from price seem to be factors that describe scale advantages and the legal structure of the fund. Asset managers charge less for large funds from large fund families, and significantly less if the strategy is exchange-traded.
The exchange-traded factor has moderated over the last several years, while the degree of passiveness factor has strengthened. We believe this is occurring because whether or not a fund is exchange-traded is no longer a proxy for passiveness. The continuing growth of active ETFs means that investors may stop expecting ultra-low costs from ETF products and look further into the strategy of the fund before setting cost expectations.

Figure 6: Average pricing premia in basis points for various fund characteristics
Some Asset Managers are Winning More than Others
Some asset managers have had more success than others when it comes to pricing their products at levels that will attract investors. Vanguard has grown its total assets by 4.3% over the last 12 months (adding $212 billion of assets) due purely to its net expense ratios. Oppenheimer Funds, on the other hand, has lost $386 million of assets as a result of its net expense ratios.
| Contribution | Assets | Contribution/Assets | |
|---|---|---|---|
| Vanguard | 211,974,514,191 | 4,905,560,161,488 | 4.3% |
| SPDR State Street Global Advisors | 22,693,753,670 | 618,786,421,312 | 3.7% |
| iShares | 44,045,032,479 | 1,404,008,455,668 | 3.1% |
| TIAA Investments | 5,315,444,534 | 182,175,519,756 | 2.9% |
| Dimensional Fund Advisors | 11,135,941,918 | 444,970,034,490 | 2.5% |
| Fidelity Investments | 43,600,714,174 | 1,861,761,479,420 | 2.3% |
| Dodge & Cox | 4,052,118,698 | 214,974,181,457 | 1.9% |
| PIMCO | 5,708,349,860 | 387,090,226,075 | 1.5% |
| BlackRock | 3,933,088,161 | 272,748,376,617 | 1.4% |
| American Funds | 23,292,882,714 | 1,710,034,913,313 | 1.4% |
| JPMorgan | 4,695,919,083 | 377,975,270,655 | 1.2% |
| T. Rowe Price | 8,221,792,731 | 784,354,052,647 | 1.0% |
| Lord Abbett | 1,293,646,137 | 132,946,037,431 | 1.0% |
| American Century Investments | 1,328,053,487 | 137,265,369,145 | 1.0% |
| Principal Funds | 1,204,357,971 | 173,392,335,982 | 0.7% |
| MFS | 1,673,099,960 | 256,461,007,024 | 0.7% |
| Franklin Templeton Investments | 2,454,176,337 | 381,810,803,174 | 0.6% |
| AXA Equitable | 945,170,858 | 149,518,865,458 | 0.6% |
| Columbia | 881,187,660 | 164,137,903,059 | 0.5% |
| Janus Henderson | 728,385,654 | 137,213,342,054 | 0.5% |
| John Hancock | 1,019,770,247 | 196,448,820,446 | 0.5% |
| Jackson National | 1,027,637,784 | 208,790,460,809 | 0.5% |
| Hartford Mutual Funds | 364,467,058 | 118,797,073,425 | 0.3% |
| Invesco | 911,459,039 | 352,732,303,344 | 0.3% |
| OppenheimerFunds | (386,501,193) | 217,136,856,152 | -0.2% |
Figure 7: Organic contributions to asset growth due strictly to the net expense ratio factor for the top 25 fund families by total assets
Conclusion
The issue of optimally pricing funds is a constant for asset managers. To leave your prices alone is to watch your competitors continue to change (often decrease) prices around you, making your products relatively less attractive.
A vigilant eye is needed to constantly keep pace with the accelerating pace of price declines and the increasing importance of price to investors. While some firms have aggressively embraced this price-focused world, others have taken a more cautious approach, and in rare cases, increased price in aggregate. A strategy of increasing prices can only be successful for the most differentiated investment products in the current environment.
Beyond decreasing fees on existing products, asset managers are also launching products at below-competitive prices in an effort to jump-start these new funds’ growth rates and get them to profitable levels of assets quickly. We’ve shown that overpricing new funds can severely set-back the first few years of growth.
If that all wasn’t complicated enough, it seems that the considerations for how to price a fund are shifting. While exchange traded funds had (and still have) steep discounts to open-end funds, the discount is shrinking. Simultaneously we see that the discount for a passive strategy is increasing. This reflects the fact that exchange-traded funds are no longer a proxy for passive investing as they once were due to the increasing prominence of active ETFs.
We see no respite in sight for asset managers facing pressure on profitability due to these trends in fees. If anything, these trends are likely to accelerate, further incentivizing industry consolidation.
References
Cornelius, F. J. (2006). Out of Sight, Out of Mind: The Effects of Expenses on Mutual Fund Flows. CFA Digest,36(3), 64-65. doi:10.2469/dig.v36.n3.4232
Miller, W. (2018). Flowspring Global Flow Model Methodology. Flowspring, Inc.
Miller, W. (2018). Elasticity Rising. Flowspring, Inc.
Contributors
Warren Miller, CFA
Founder & CEO
warren.miller@flowspring.com
©Flowspring, Inc. All Rights Reserved. The information, data, analyses and opinions presented herein do not constitute investment advice; are provided solely for informational purposes and therefore are not an offer to buy or sell a security; and are not warranted to be correct, complete or accurate. The opinions expressed are as of the date written and are subject to change without notice. Except as otherwise required by law, Flowspring shall not be responsible for any trading decisions, damages or other losses resulting from, or related to, the information, data, analyses or opinions or their use. The information contained herein is the proprietary property of Flowspring and may not be reproduced, in whole or in part, or used in any manner, without the prior written consent of Flowspring.