Solar-Powered Fund Flows
How the Morningstar Star Ratings Drive Fund Flows
April 2018
Conflict of Interest: The author is a former employee of Morningstar with friendships with current Morningstar personnel. In addition, Flowspring sources a significant portion of its data from Morningstar. However, this article makes every attempt to be impartial, and there is no intentional bias in any of the analysis we put forth herein.
Executive Summary
It’s no secret that independent 3rd party fund ratings influence the way investors think about mutual funds and ETFs. The Morningstar Star Rating, in particular, has shown to be predictive of future fund flows. We examine this relationship in more depth and find some interesting nuance to the link between the Morningstar Star Rating and fund flows. Our key findings include:
We estimate that more than half a trillion dollars in gross flows were directly attributable to the Morningstar Star Rating in 2017.
The relationship between the Morningstar Star Rating and fund flows is non-linear. There are huge benefits to having 5-Stars and even greater penalties for having 1-Star, but very little differential among 2-, 3-, and 4-Stars.
Morningstar Star Ratings change relatively infrequently. After a 1-year time horizon, 60% of shareclasses have the same Star Rating and 96% have changed by 1 Star or less.
A 5-Star rating can be worth as much as $28 million in new fees. Funds that extract more value from a high Morningstar Star Rating are more likely to earn a high Star Rating given the correlation between Star Ratings and fund size.
A Brief History of the Morningstar Star Rating
The Morningstar Star Rating came into existence in 1985, just one year after Joe Mansueto, Morningstar’s founder, started Morningstar in his Chicago apartment. From its humble beginnings distributed in hard copies of Morningstar’s Mutual Funds, it has grown to influence the movement of billions of dollars of capital each month.
In fact, we can estimate the exact amount of flows attributable to the Morningstar Star Rating using the Flowspring Global Flow Model – a factor model of fund flows. We find that, on average, the Star Rating is responsible for $38 billion in gross flows per month across all mutual funds and ETFs.
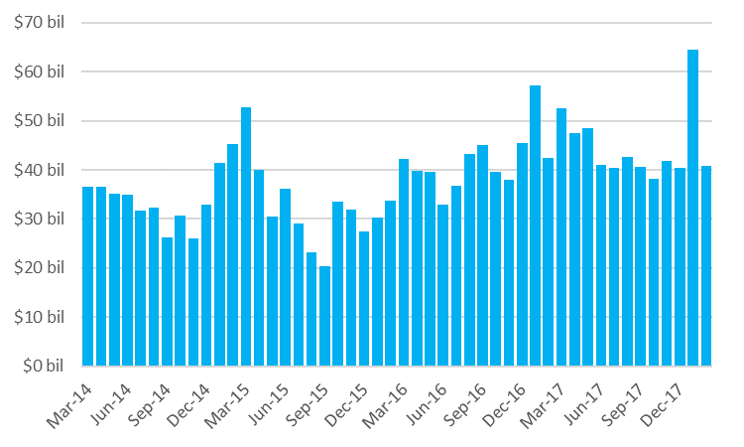
Figure 1: Gross flows attributable to the Morningstar Star Rating by month
While the Star Rating has always been a backward-looking indicator of a fund’s performance, it has gone through iterations of enhancements over its lifespan. The most significant were the introduction of category-based peer groups and fractional weighting in 2002, and more robust global calculations in 2006.
Today, the Star Rating is a lucrative business-line for Morningstar, generating 4% of the company’s $911 million in revenue, and an even higher share of its profits. Most, if not all, major asset management firms license the Morningstar Rating for use in their advertising to persuade investors that their funds are superior to competitors.
Because of its prominence in the asset management industry, the Star Rating has been studied extensively for its ability to predict future fund investment performance. While such studies have been, at times, contentious (see The Morningstar Mirage from the Wall Street Journal and Morningstar’s several rebuttals), the consensus is that the Star Ratings are weakly predictive of future performance.
In addition, the Morningstar Star Rating has been studied for its ability to predict fund flows. There is broad agreement among these studies that there is a positive relationship between fund flows and Star Rating. In the remainder of this paper, we dig deeper into this relationship to expose several nuances in this relationship.
Star Rating is Among the Biggest Drivers of Fund Flows
The Flowspring Global Flow Model is a factor-based model of fund flows to mutual funds and ETFs. We include dozens of factors in this model, including those that describe a fund’s performance, its product characteristics (category, fee structure, management team), it’s brand, and its distribution skill. Among these factors, the Morningstar Star Rating stands out as the third greatest explanatory variable for fund flows after fund age and fees.

Figure 2: The importance (average absolute value of contribution to flow growth across all funds and ETFs) of selected factors from the Flowspring Global Flow Model
Moreover, this relationship is non-linear, and remarkably stable through time. 5-Star funds experience a flow-based growth tailwind of 4% per year, while 1-Star funds face a headwind of 7% per year. 2-, 3-, and 4-Star funds are less distinct from each other, each with tailwinds between 0% and 2% per year. Clearly, investors are concerned with putting themselves in the best performing funds and avoiding the worsts performers, but less effort is expended differentiating between middling funds.

Figure 3. Non-linear relationship between Morningstar Rating and Fund Flows
The relationship between Morningstar Star Ratings and fund flows may owe part of its stability to stability in the Star Ratings themselves. At a 1-year time horizon, about 40% of shareclasses change Star ratings, but 96% are within 1 notch of their initial rating from 1-year prior. This rating stability is unsurprising given the incorporation of 10-years of historical returns in the Morningstar Star Rating methodology.
Figure 4: Transition matrix for Star Ratings at a 1-year horizon
Star Rating Changes Highlight Investor Inertia
When a Morningstar Star Rating changes, we observe an immediate reaction in flows. Within the first week, investors send more net flows to funds that have been upgraded and redemptions to funds that have been downgraded. Clearly, some investors employ a rule-like approach to investing that may require a fund to be rated 5-Stars (or at least not be rated 1-Star) as a prerequisite to inclusion in their portfolio. In fact, for funds that have fallen by more than 3 notches, the 1-week time horizon is when the most significant reaction occurs.
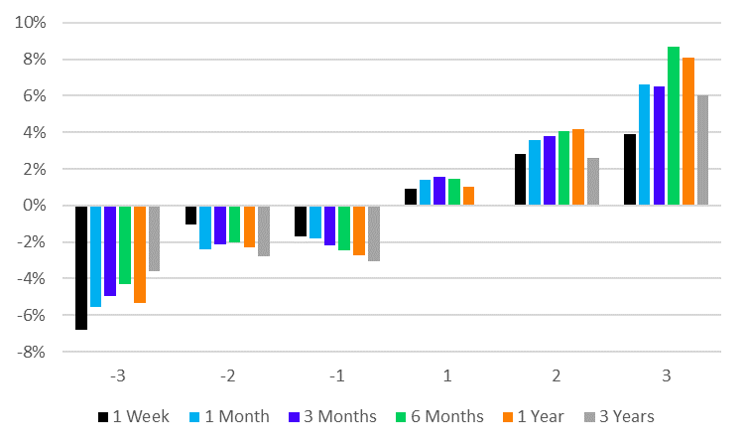
Figure 5: Event study of the change in flow-growth (y-axis) after a rating change event over various time horizons.
However, for any rating change except those that lost 3 notches, flows continue to change, on average, over the subsequent one year, indicating that some investors are slower to react. These investors may expend less energy staying in-tune with Morningtar’s Star Ratings on a day-to-day basis, or they may be more susceptible to the delayed marketing and advertisements from asset managers which tend to prominently display favorable Star Ratings (even sometimes after the rating has reverted back to a lower level).
The Value of a Star Rating
Since the Flowspring Global Flow model calculates the extra flow-based growth attributable to a 5-Star rating, it’s trivial to assign a dollar value to a 5-Star rating by multiplying that growth rate by the shareclasses’ total net assets and multiplying once more by its expense ratio.
Using this simplistic method, which assumes funds hold on to a 5-Star rating for exactly a year, we find that the average 5-Star rating is worth $229,000 in new fees. The largest value for a 5-Star Rating is roughly $28 million for a fund shareclass that manages $95 billion at a 0.75% expense ratio – this fund currently is assigned 4-Stars. On the other hand, many funds have a $0 value for a 5-Star rating because they have a 0% expense ratio (and therefore would experience no incremental fees despite the additional flows a 5-Star rating might bring).
More interesting, we find that star ratings and the value of the star rating have a positive correlation – that is, firms who stand to benefit more from a high star rating tend to receive a high star rating.
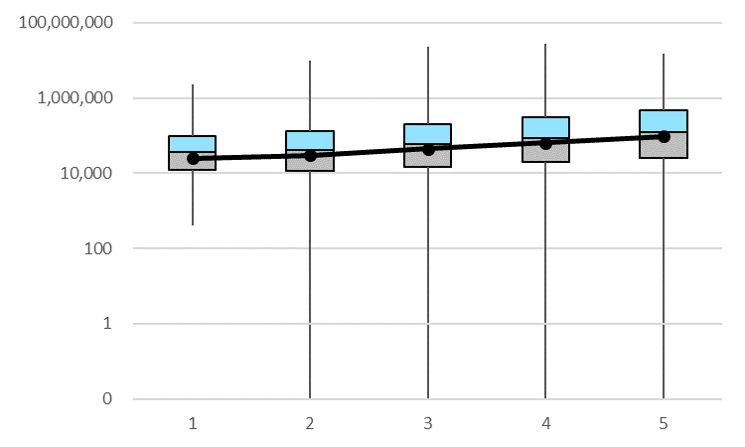
Figure 6. Correlation of Morningstar Star Rating (x-axis) and value of Star Rating (y-axis)
On the surface this may seem a bit nefarious, but it’s a natural effect driven by the mechanics of the Star Rating itself. Star Ratings are a backward-looking measure of performance, therefore funds that have done well (grown their assets by a large amount) will achieve higher star ratings and be larger than their slower-growth counterparts. Compounding this effect is that investors, as we’ve seen above, send additional flows to funds that have high Star Ratings. Consequently, there is a positive correlation between fund size and Star Rating, and therefore a positive correlation between Star Rating value and Star Rating.
Conclusion
We’ve shown herein that Star Ratings are stable, exhibit a non-linear relationship to flows, and influence more than half a trillion dollars in gross flows within the fund and ETF industry each year.
There is no doubt that the Morningstar Star Rating is a powerful force in the asset management industry. Most asset managers tend to recognize this fact – some going as far as replicating the methodology internally to anticipate Star Rating changes and position their products in marketing and advertising campaigns accordingly.
After fund age and expense ratio, the Star Rating is the most important driver of fund flows. Therefore, to be ignorant of your fund’s Star Ratings is to be ignorant of a major catalyst of flow variation. Asset managers that strive to understand and optimize their fund flows would be wise to pay attention to their Star Ratings versus those of their competitors.
It remains to be seen if the Star Rating will continue to hold the level of influence it has over the industry. To their credit, Morningstar emphasizes that the Star Rating should only be used as part of a more comprehensive due diligence process. Should investors want to start their investment process with a Morningstar rating, they may be better served to make use of the newer Morningstar Analyst Rating which, unsurprisingly, is assigned by human analysts as a reflection of their qualitative analysis of a fund’s future investment prospects.
References
Aasheim, L. K. (2013). The Effect of the Morningstar Rating on Fund Flows in the Norwegian Mutual Fund Market(Unpublished master's thesis). ISCTE Business School.
Berk, J., & Green, R. (2002). Mutual Fund Flows and Performance in Rational Markets. doi:10.3386/w9275
Davidson, Lee, and Timothy Strauts. What Factors Drive Investment Flows. Morningstar, Inc., 2015.
Del Guercio, D. and Tkac, P. (2001). Star Power: The Effect of Morningstar Ratings on Mutual Fund Flows. SSRN Electronic Journal.
Grind, K., McGinty, T., & Krouse, S. (2017, October 25). The Morningstar Mirage. The Wall Street Journal. Retrieved from https://www.wsj.com/articles/the-morningstar-mirage-1508946687
Kapoor, K. (2017, October 25). Morningstar is Relentlessly Committed to Independence, Integrity, and Transparency. Retrieved from http://www.morningstar.com/company/message-from-ceo
Krouse, S., & Grind, K. (2017, November 19). Some Fund Ads Misrepresent Morningstar Ratings. The Wall Street Journal. Retrieved from https://www.wsj.com/articles/many-fund-ads-misrepresent-morningstar-ratings-1510958391
Ptak, J. (2017, October 25). Setting the Record Straight on Our Fund Ratings. Retrieved from http://news.morningstar.com/articlenet/article.aspx?id=831740
Ptak, J., Davidson, L., Douglas, C., & Zhao, A. (2016). Analyzing the Performance of the Star Rating Globally.
Wermers, R. R. (2003). Is Money Really Smart? New Evidence on the Relation Between Mutual Fund Flows, Manager Behavior, and Performance Persistence. SSRN Electronic Journal. doi:10.2139/ssrn.414420
Contributors
Warren Miller, CFA
Founder & CEO
warren.miller@flowspring.com
©Flowspring, Inc. All Rights Reserved. The information, data, analyses and opinions presented herein do not constitute investment advice; are provided solely for informational purposes and therefore are not an offer to buy or sell a security; and are not warranted to be correct, complete or accurate. The opinions expressed are as of the date written and are subject to change without notice. Except as otherwise required by law, Flowspring shall not be responsible for any trading decisions, damages or other losses resulting from, or related to, the information, data, analyses or opinions or their use. The information contained herein is the proprietary property of Flowspring and may not be reproduced, in whole or in part, or used in any manner, without the prior written consent of Flowspring.